ROOTS 2016 reveals consumer habits
After 28 000 interviews in 120 urban communities, ROOTS 2016, Caxton’s much anticipated urban community survey, has been launched by SPARK Media.
The research provides marketers, advertisers and retailers with intelligence and insights into the consumer's media, shopping, technology and leisure habits at a local community level.
One of the key features of the ROOTS data is the ability to drill down to micro level across a wide array of categories. A good example is the purchasing-decision process with regards to food and groceries.
ROOTS 2016 shows that most food and grocery shoppers still shop in bulk once a month with some top-ups (53%) throughout the month. The frequency of fortnightly shopping is steadily increasing from 10% in 2004, 26% in 2013 to 34% in 2016.
“ROOTS 2016 has given us powerful insights into consumers at a local level,” says Gill Randall, CEO of SPARK Media. “For instance, we know that consumers are shopping more often throughout the month rather than completing a bulk shop like we used to. We believe that one of the reasons for this is the explosion of shopping centres around the country, making access to retailers so much easier.”
When it comes to planning shopping trips, 90% of food and grocery shoppers surveyed said that they plan their grocery-shopping trip. Sixty percent always plan and 29% sometimes plan.
Most planning takes place a day or two before the big shop (64%) and most shopping takes place over the weekend. Seventy two percent of grocery shoppers do all or most of their shopping over the weekend and only 11% do all or most of their shopping during the week.
“ROOTS 2016 allows us to look at this data at a local level, and everything changes by area,” she says. “For example, 71% of purchase decision makers (PDMs) in Springs and Boksburg do one big bulk shop a month and some top-ups. This number for Gugulethu is 73%. Cape Town is the area with the most frequent shopping, with Bellville/Durbanville having the highest percentage of shoppers shopping twice a week or almost daily at 42%, followed by Rondebosch.
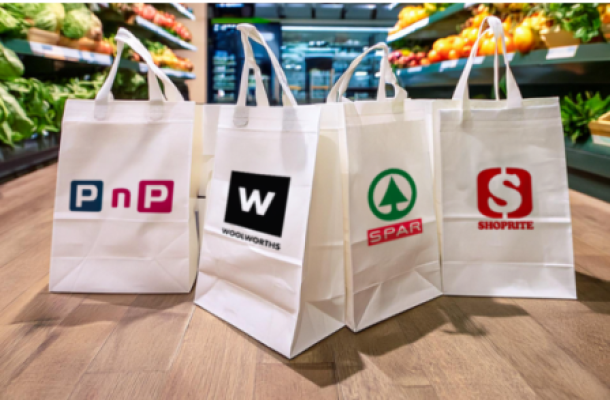
Across the entire survey, the top-ten retailers for food and grocery shopping are:
|
Shoprite |
49% |
|
Pick n Pay Discount/Family Supermarket/Mini Market |
43% |
|
Spar |
32% |
|
Checkers |
29% |
|
Pick 'n Pay Hypermarket |
22% |
|
Woolworths |
16% |
|
Checkers Hyper/Hyperama |
14% |
|
Clicks |
14% |
|
Spaza Shop |
13% |
|
Fruit & Veg City |
10% |
More importantly for advertisers and marketers, is that these figures change dramatically by area. For example, in Pietermaritzburg 57% of PDMs shop at Spar, while nationally only 32% do their shopping at Spar:
|
Spar |
57% |
|
Pick n Pay Discount/Family Supermarket |
48% |
|
Checkers |
37% |
|
Supersave Store |
21% |
|
Shoprite |
21% |
|
Clicks |
19% |
|
Woolworths |
13% |
|
Fruit & Veg City / Food Lovers Market |
9% |
|
U Save |
9% |
|
Other |
7% |
In Ruimsig, Shoprite does not even feature, but nationally it is at the top of the list at 49%:
|
Spar |
45% |
|
Pick n Pay Discount/Family Supermarket |
45% |
|
Checkers |
40% |
|
Pick n Pay Hypermarket |
40% |
|
Checkers Hyper |
19% |
|
Woolworths |
16% |
|
Clicks |
12% |
|
Makro |
10% |
|
Fruit & Veg City / Food Lovers Market |
8% |
|
Dis-Chem |
7% |
“The marketing battle is fought on the ground at local level, even for national brands. It is all about local relevance. With the data in hand, it’s crucial that marketers and retailers decide how best to use that information within a broader framework of globally proven consumer behaviour laws,” says Gill.
Top line data is available on www.sparkmedia.co.za.
News Category
- International retailers
- On the move
- Awards and achievements
- Legislation
- Wine and liquor
- Africa
- Going green
- Supplier news
- Research tools
- Retailer trading results
- Supply chain
- Innovation and technology
- Economic factors
- Crime and security
- Store Openings
- Marketing and Promotions
- Social Responsibility
- Brand Press Office
Related Articles

Checkers Sixty60 wipes floor with Pick n Pay As...

Top tips for consumers to combat escalating ele...

Clear winner in South African retail battle

Drinks survey reveals Rooibos as a top choice a...


