The best and worst supermarkets in South Africa
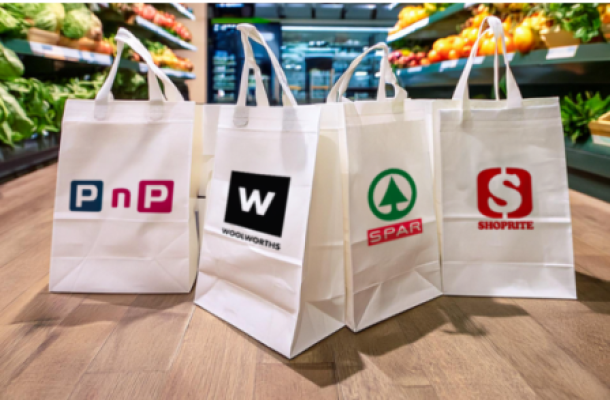
The latest South African Customer Satisfaction Index (SAcsi) for supermarkets, reveals that customers remain highly satisfied with the country’s major shopping retailers. Research company, Consulta, surveyed nearly 3,000 randomly selected customers of supermarkets including: Woolworths, Shoprite, Checkers, Pick n Pay, and Spar.
The index blends customer expectations, perceived quality, and perceived value to achieve an overall result out of 100.
With a substantially higher score than the industry average of 76.2, Woolworths achieved the most satisfied customers with a score of 82.1 on the index and is the only supermarket with a marked increase compared to its 2015 average of 80.7.
Checkers, with a score of 77.2, and Pick n Pay at 76.5 both remained above average while Shoprite and Spar trailed with scores of 75.5 and 75.2 respectively.
|
# |
Brand |
Score |
|
1 |
Woolworths |
82.2 |
|
2 |
Checkers |
77.2 |
|
2 |
Pick n Pay |
76.5 |
|
4 |
Shoprite |
75.5 |
|
5 |
Spar |
75.2 |
|
Industry Average |
76.2 |
While South African customers appear to be generally happy and overall customer satisfaction is still high, scores for customer loyalty declined across all supermarket brands analysed in 2016 compared to scores in 2015.
Overall customer loyalty decreased from 76.4 in 2015 to 74.2 in 2016, yet Woolworths held steady with the most loyal customers and a score of 77.3 followed by Shoprite (74.9), Pick n Pay (74.6), Spar (73.5) and then Checkers (72.5).
“In tough economic times, the price of goods is likely to influence consumers’ loyalty even though they are satisfied customers,” said CEO of Consulta, professor Adré Schreuder.
“But price-motivated ‘loyalty’ is not permanent so while customers may display less brand loyalty now, supermarkets cannot afford to stop investing in positive shopping experiences.”
Customer expectation refers to the total perceived benefits a customer expects from a company’s product or service. If the actual experience customers have with a supermarket exceeds the expectation, they are typically satisfied, Consulta said.
The 2016 industry average for customer expectation is 78.3. “This number shows us the extent to which customers demand value from their preferred brands,” said Schreuder.
A related study by Nielsen showed that when selecting a supermarket, South African consumers are highly influenced by convenience of location (71%), speed (61%), high-quality fresh produce (71%) and product availability (68%) more so than price (56%) and promotions (56%).
Woolworths achieved a perceived quality score of 87 and perceived value score of 80.6, compared to the industry average of 80.3 on perceived quality and 76.5 on the perceived value.
“Woolworths has succeeded in providing high quality products, convenience and fast service while growing its footprint rapidly, including a growing presence in petrol station forecourts,” Schreuder said. This is testament to the fact that customers are willing to pay for quality products when they can afford to.
The SAcsi for supermarkets includes a Net Promoter Score (NPS) that measures the percentage of customers who would recommend a supermarket to their family and friends minus the percentage of those with a low likelihood to recommend.
The highest Net Promoter Score was attained by Woolworths at 50%, scoring 18% higher than the industry average, and 24% higher than Checkers at the opposite end of the scale.
“A high likelihood to recommend demonstrates that customers appreciate supermarkets that deliver on their expectations and continue innovating to address evolving needs,” Schreuder said.
News Category
- International retailers
- On the move
- Awards and achievements
- Legislation
- Wine and liquor
- Africa
- Going green
- Supplier news
- Research tools
- Retailer trading results
- Supply chain
- Innovation and technology
- Economic factors
- Crime and security
- Store Openings
- Marketing and Promotions
- Social Responsibility
- Brand Press Office
Related Articles

Checkers Sixty60 wipes floor with Pick n Pay As...

Top tips for consumers to combat escalating ele...

Clear winner in South African retail battle

Drinks survey reveals Rooibos as a top choice a...


